Estimated reading time: 4 minutes
Looking to understand MACD and how to use it effectively? Our comprehensive guide covers the basics of the MACD indicator, including its essential components and how it helps traders identify market trends. We also delve into the best MACD settings for optimizing your trading strategy. Whether you’re new to technical analysis or looking to refine your approach, this guide will equip you with the knowledge to make informed trading decisions and enhance your market analysis.
What is MACD in Trading?
The Moving Average Convergence Divergence (MACD) is a popular trend following indicator used in technical analysis by traders and investors to identity potential buy and sell signals. MACD indicator is widely used tool in the trading world after developed by Mr. Gerald Appel in the late 1970s. This indicator is effective for both short-term and long-term traders.
Here is a list of common trend following indicators
- Moving Average (MA)
- Average Directional Index (ADX)
- Parabolic SAR
- Ichimoku Cloud
- Bollinger Bands
- Donchian Channels
- Keltner Channel
- Supertrend Indicator
- Price Oscillator (PO)
Understanding Basics of MACD
MACD indicator shows the relationship between two moving averages of a security’s price. It consists of three main components.
Accelerator Oscillator Indicator: Bill Williams Momentum Tool
- MACD Line : It’s also called fast line and calculated by subtracting the 26 day Exponential Moving Average (EMA) from the 12 day EMA. MACD line is the primary line and indicates the momentum of a stock or asset.
- Signal Line : It’s act as a trigger for buy or sell signals. This slow line is a 9 day EMA of the MACD line. When the MACD line crosses above the signal line, it may indicate a bullish signal. Conversely, when the MACD line crosses below the signal line, it may indicate a bearish signal.
- Histogram : The histogram represents the difference between the MACD line and the signal line. It visually displays the gap between the two lines, allowing traders to assess the strength of the momentum. An expanding histogram indicates increasing momentum, while a contracting histogram signals weakening momentum.
What is the best MACD setting?
Scalping Trading : 9 and 15 EMA Strategy
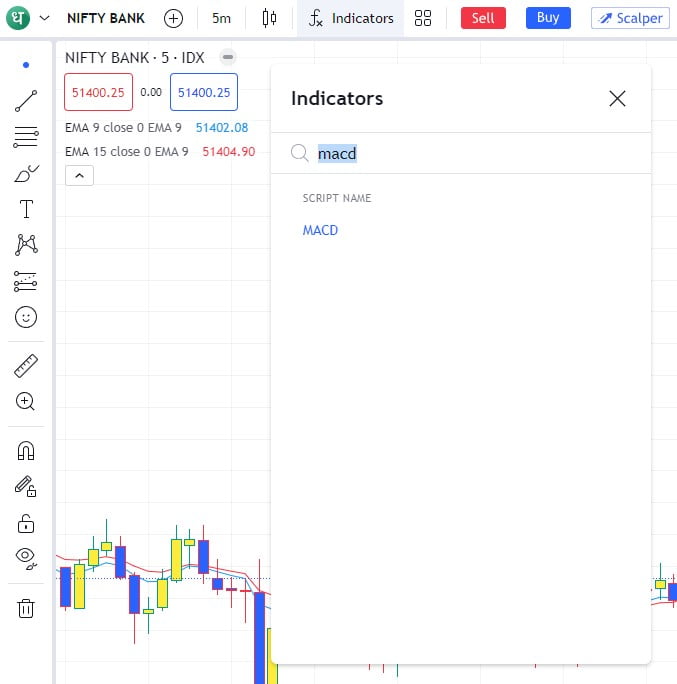
Login into your trading account and open the chart. Click on indicator, search for “MACD” and tap on it.
The best MACD settings can depends on your trading strategy and time frame. However, the default settings are often used as a starting point.
Fast EMA : 12 periods
Slow EMA : 26 periods
Signal Line : 9 periods
Online Trading for Beginners: How to Get Started and Succeed
These MACD settings are widely used and provide a good balance for many traders.
Here’s a bit more detail on how different settings can impact the MACD indicator:
Shorter Settings:
Fast EMA: 5-9 periods
Slow EMA: 13-21 periods
Signal Line: 5-7 periods
Cup and Handle Pattern: A Proven Strategy for Bullish Markets
Use Case: These settings are more sensitive and can provide quicker signals. They may be suitable for day traders or those looking to capture short-term price movements. However, they can also produce more false signals due to increased noise.
Longer Settings:
Fast EMA: 15-20 periods
Slow EMA: 30-50 periods
Signal Line: 10-15 periods
Use Case: These settings are less sensitive and can help to smooth out the indicator, making it more suitable for long-term traders or investors who are focusing on major trends. They can reduce the number of false signals but may be slower to react to changes.


1 Comment
Pingback: Trade Maximize - Be Financially Independent